Markets had a tough month in July 2026, with major stock indexes finishing slightly down. That said, stocks are still well ahead for the year and remain close to all-time highs. Key events driving markets included fresh concerns about AI spending, rising bond yields, higher oil prices after a ceasefire broke down in the Middle East, and the Federal Reserve (the U.S. central bank) holding interest rates steady.
Many of these developments are part of bigger, ongoing trends that could keep markets moving up and down in the months ahead. Understanding what happened in July can help investors stay focused and prepared for the rest of the year.
Key highlights from July:
• The S&P 500 and Nasdaq fell -0.1% and -3.2%, respectively, while the Dow Jones Industrial Average edged up 0.3%.
• The VIX (a measure of how much volatility investors expect in the market) climbed as high as 21 mid-month before easing back to around 16.
• International developed market stocks returned 1.9% (MSCI EAFE Index, in U.S. dollars), while emerging market stocks fell -3.3% (MSCI EM Index).
• The 30-year U.S. Treasury yield hit a 19-year high, closing around 5.28%, and the 10-year yield ended at 4.74%. The Bloomberg U.S. Aggregate Index fell -1.3%.
• Oil prices rose, with Brent crude briefly topping $100 before closing at $90 per barrel and WTI at $85 per barrel.
• The U.S. Dollar Index (DXY) dipped just under 100, the Japanese Yen weakened significantly to around 157, and gold ended roughly flat at about $4,050 per ounce.
• Second quarter real GDP (a measure of overall economic output, adjusted for inflation) grew at an annual rate of 1.5%, down from 2.1% in the first quarter.
• The Federal Reserve voted 9-3 to keep its benchmark interest rate unchanged at 3.50%–3.75%.
AI spending raises questions for technology investors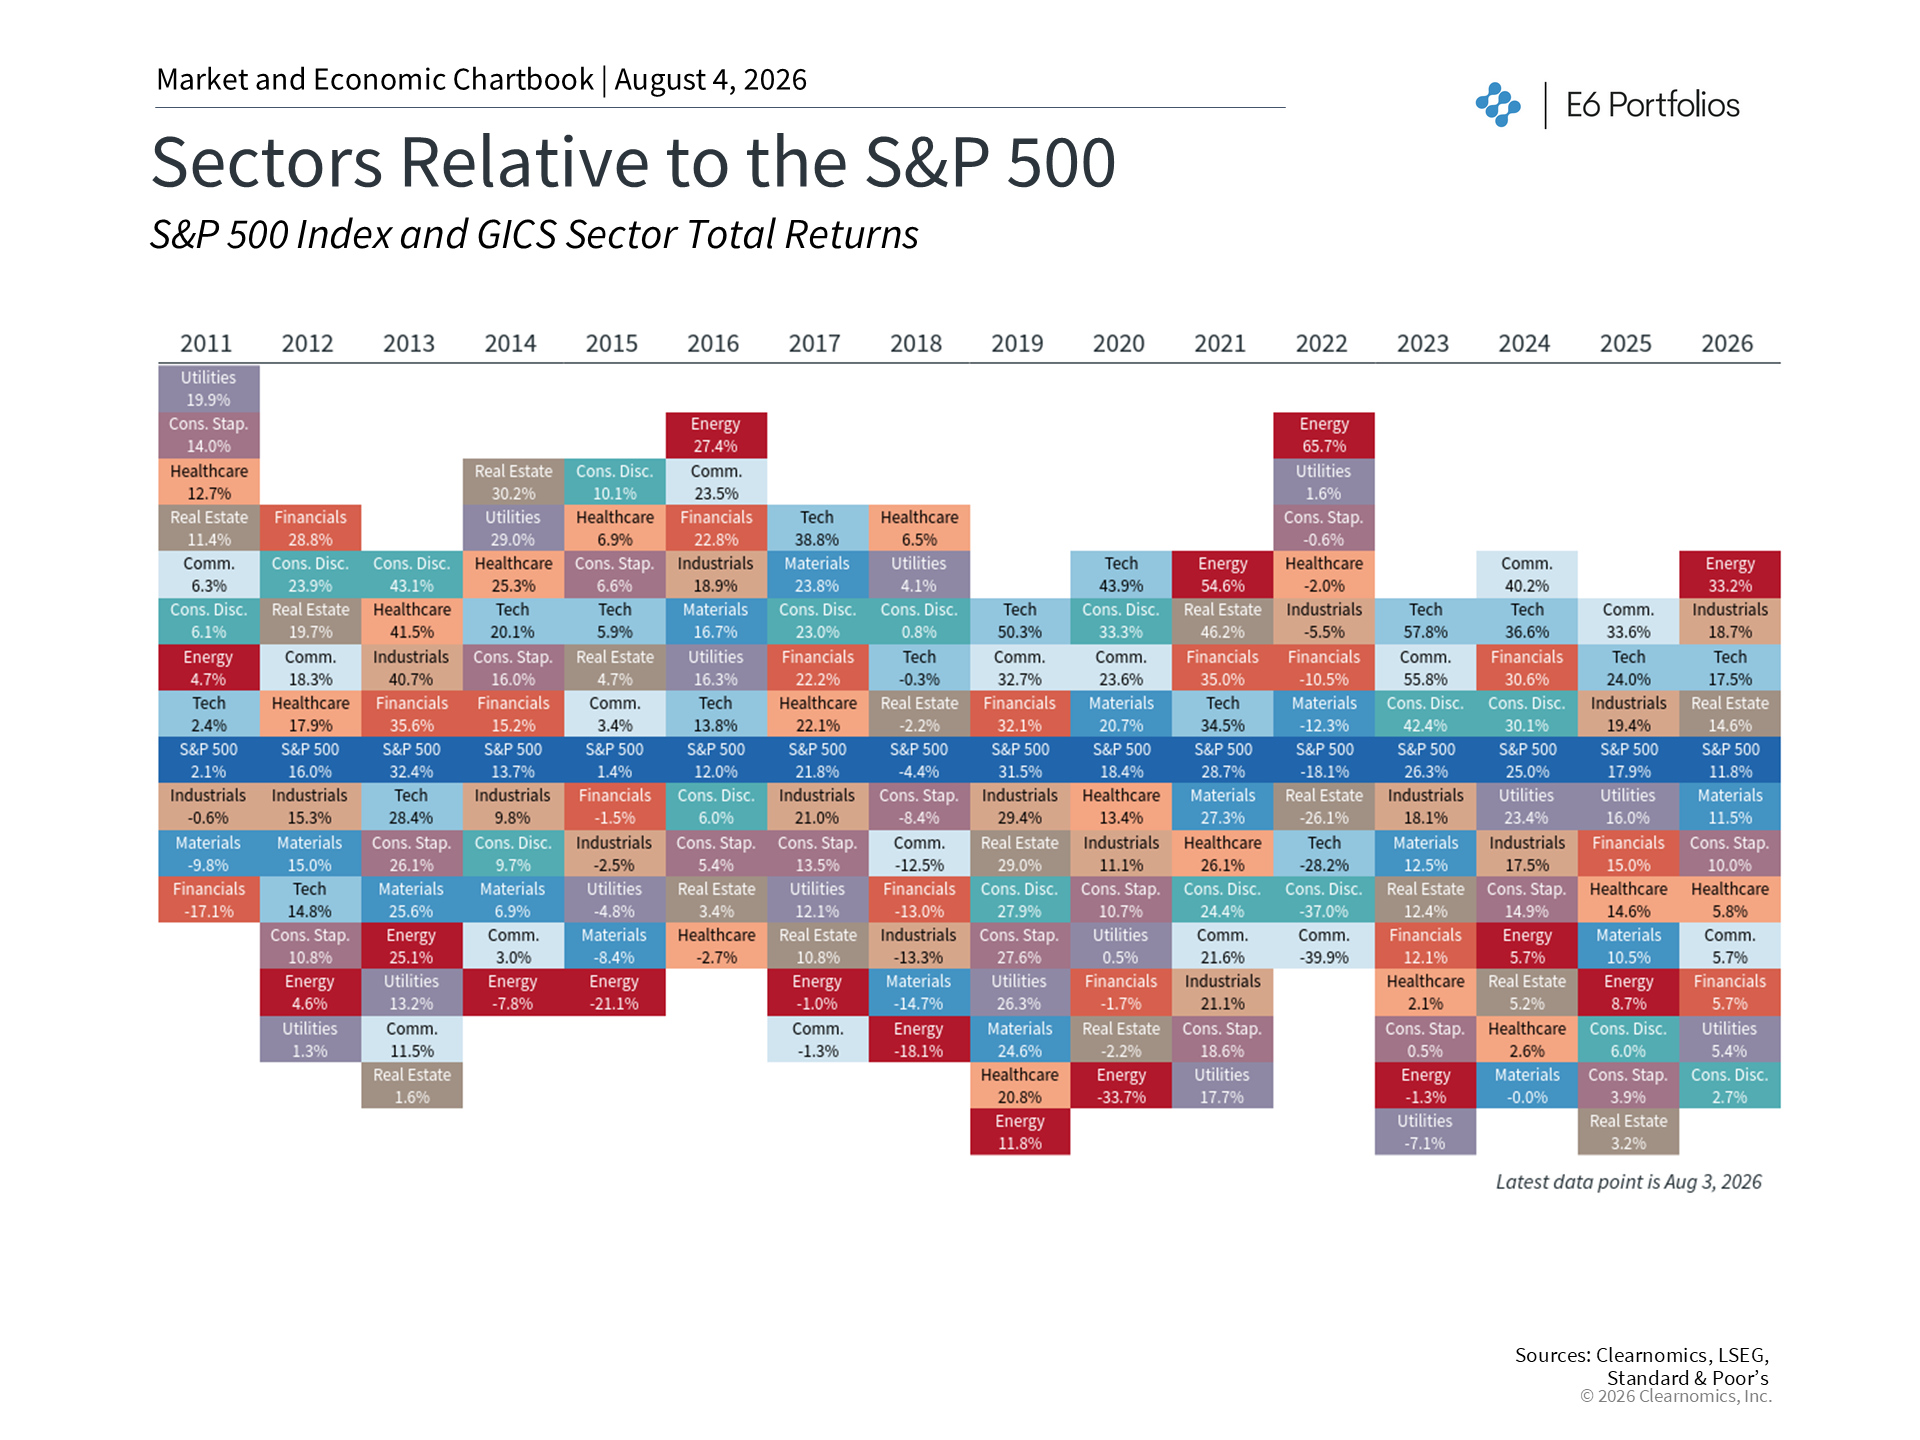 |
Second quarter earnings reports from major technology companies stirred debate about AI investment. Investors focused on whether the enormous sums being spent on data centers and AI infrastructure by large tech firms, often called "hyperscalers," would eventually lead to strong profits. Spending on data centers has grown so large that it now contributes meaningfully to the overall U.S. economy, surpassing all other categories of office construction.1
These concerns also spread to global semiconductor (computer chip) companies, causing sharp price drops. For example, South Korea's KOSPI 200 index fell 24% in July after a strong run in 2025. In addition, a Chinese company called Moonshot AI released a new AI model called Kimi K3, which reportedly rivals the most advanced models from leading AI firms.2 This model is also "open weight," meaning anyone with the right hardware can use it directly, unlike most leading models that are privately owned and controlled.
Credit rating agency Fitch also flagged what it called "major credit risk" across the AI industry, pointing to slowing consumer interest and the closely linked financial relationships among major players.3 As the chart above shows, other sectors such as Energy and Industrials have also performed well this year. For long-term investors, staying balanced across different sectors and asset classes remains important, even as AI continues to be a major market theme.
Middle East conflict briefly pushes oil back above $100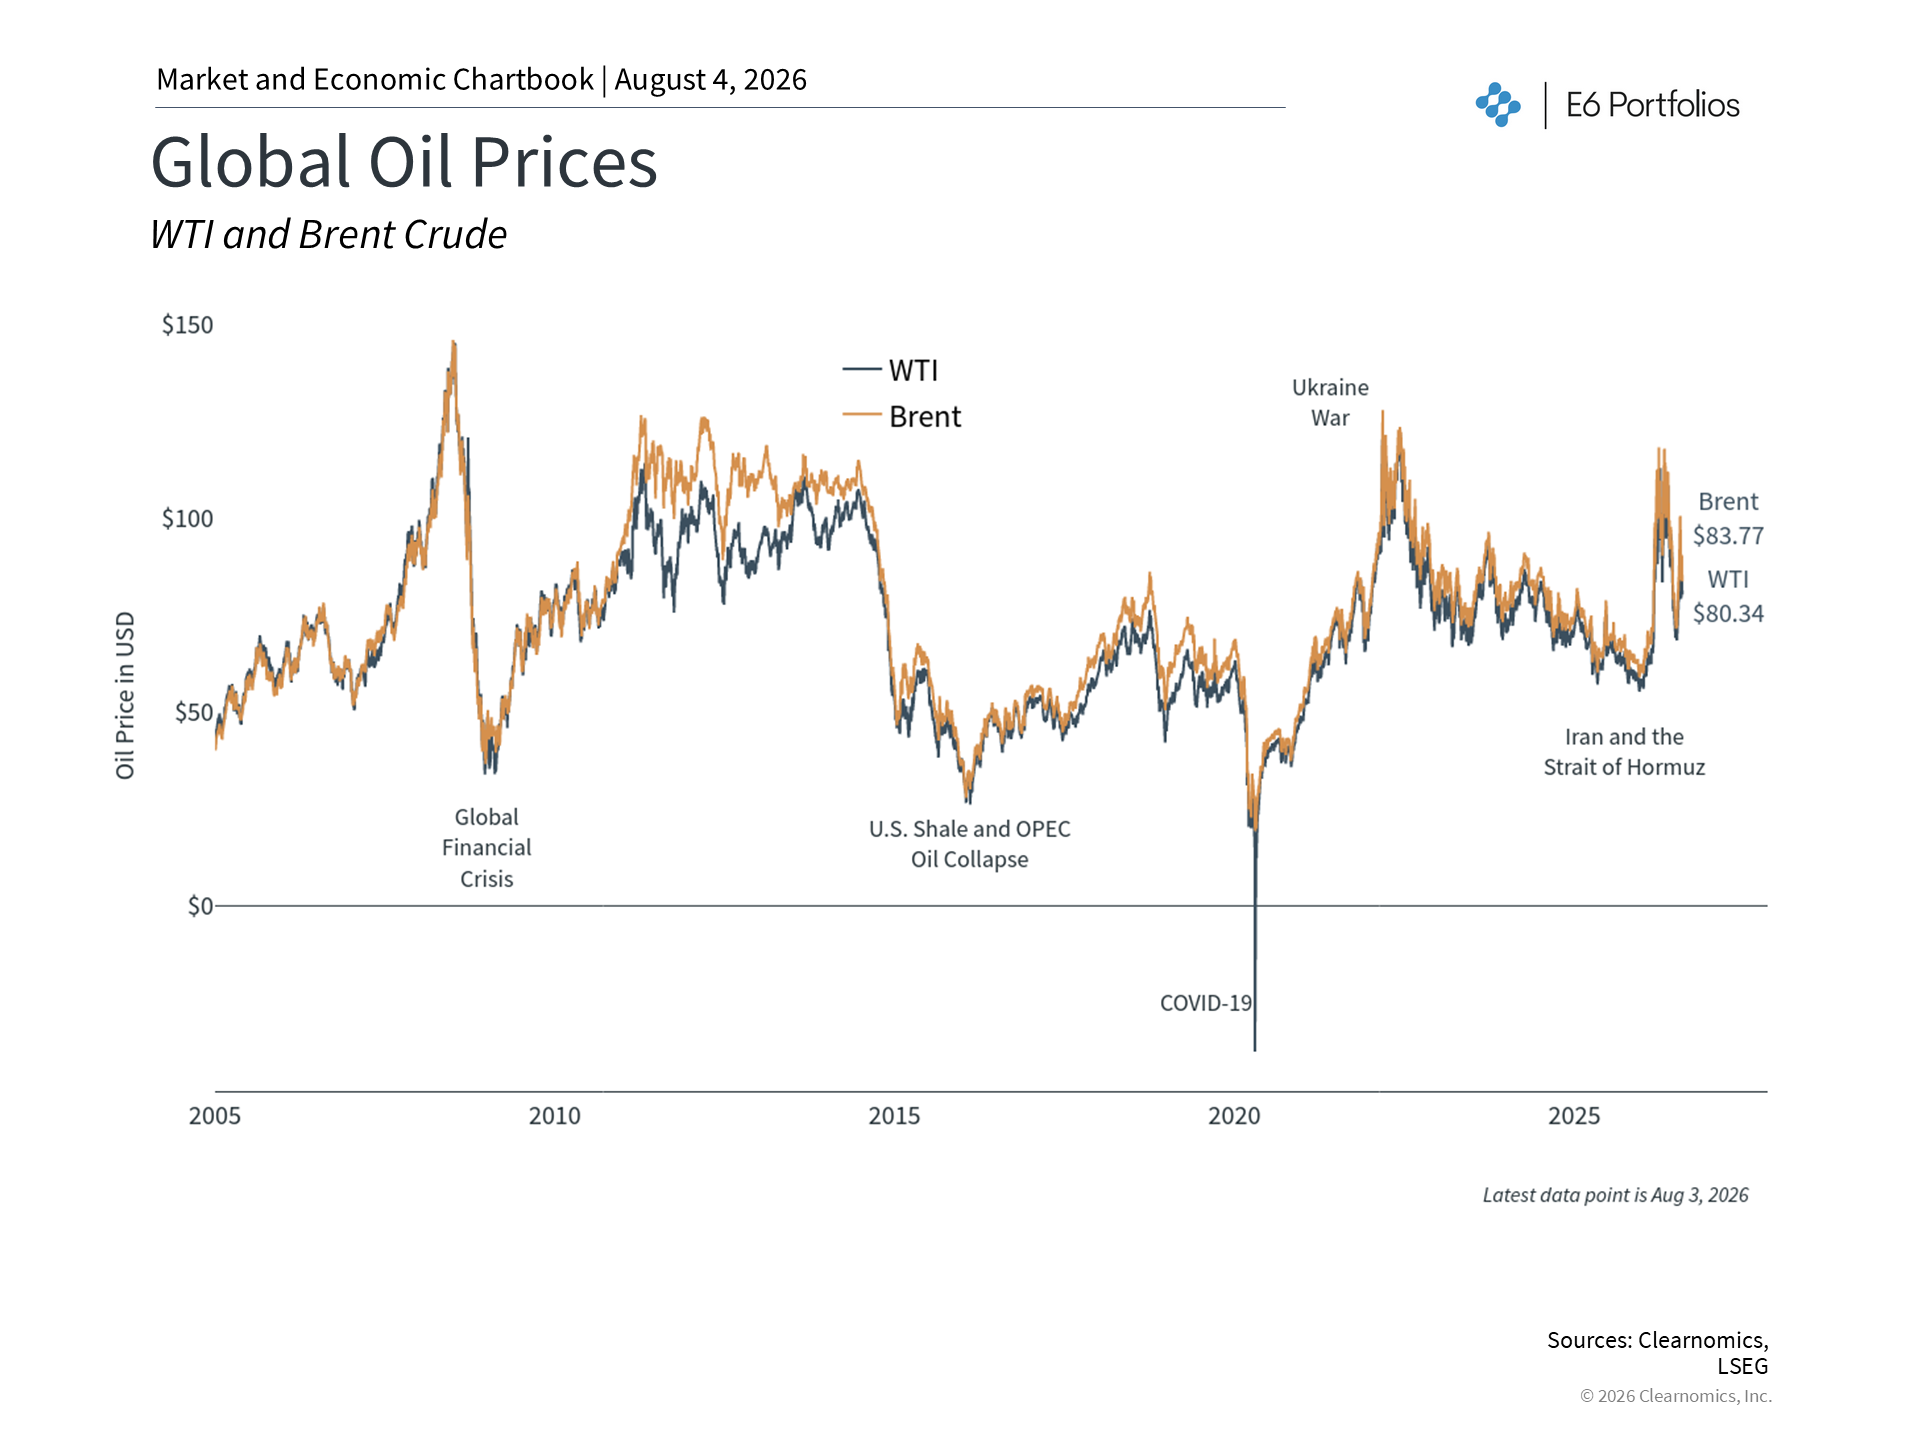 |
Conflict in the Middle East also moved markets in July. Tensions escalated mid-month when U.S. airstrikes targeted Iranian military sites, slowing traffic through the Strait of Hormuz, a key route for global oil shipments. The conflict widened further when Yemen's Houthi forces struck Saudi Arabian oil tankers near the Bab al-Mandeb Strait in the Red Sea.4
As a result, Brent crude oil briefly rose above $100 per barrel before settling near $90 by month-end, up from a low of around $72 earlier in July. Higher energy prices affect everyday consumers and businesses by raising fuel costs. Gasoline prices remain around $4.10 per gallon nationally, which could keep overall inflation higher.5
The Federal Reserve holds rates amid a divided committee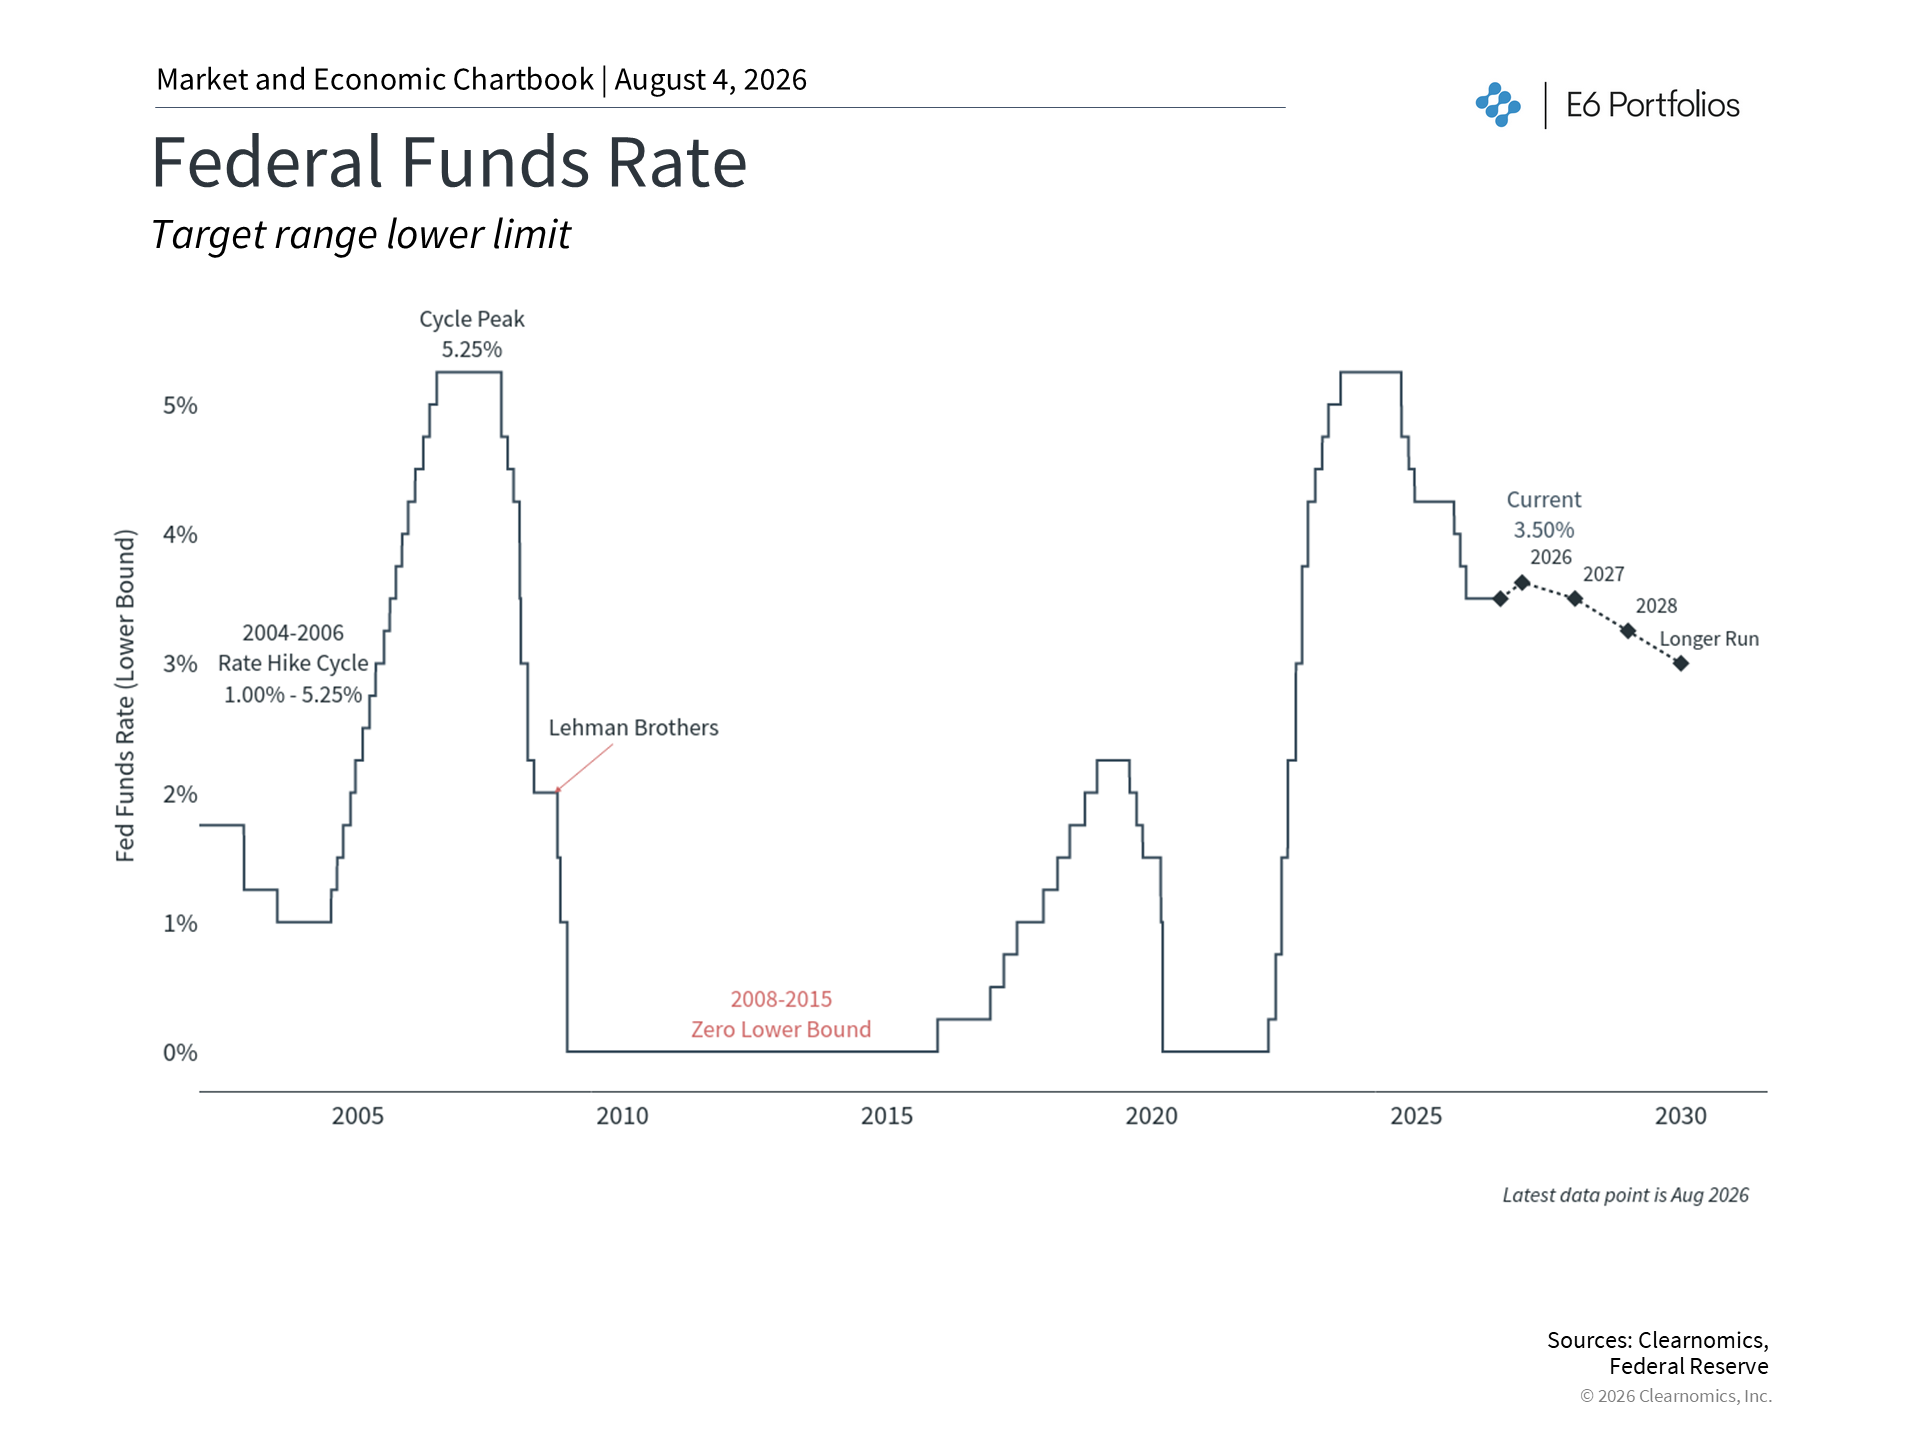 |
The Federal Reserve kept its benchmark interest rate unchanged at 3.50%–3.75% at its July meeting, even as inflation concerns lingered.6 New Fed Chair Kevin Warsh has moved away from providing detailed guidance about future rate decisions, meaning investors have less information about what the Fed might do next. This uncertainty helped push bond yields higher, with both standard and inflation-adjusted Treasury yields reaching their highest levels in recent years.
Notably, three Fed officials voted in favor of raising rates, a level of disagreement not seen since September 2016. Markets currently expect the Fed could raise rates once by October 2026, and possibly twice by mid-2027. For investors, while this uncertainty may cause bond prices to fluctuate, higher yields can also offer better income opportunities within a diversified portfolio.
New tariffs add more economic uncertainty
New tariffs (fees charged on imported goods from other countries) also created uncertainty in July. After the Supreme Court struck down previous tariffs, the administration introduced new ones under different trade laws. As a result, many countries now face tariffs of 10% to 12.5%, while certain Canadian goods such as cement, dairy, and alcohol face a 50% tariff under Section 338 of the Tariff Act of 1930.7
While tariffs can affect specific industries and raise some consumer prices, companies often adapt over time. The broader economy has continued to grow and the S&P 500 has reached multiple new highs over the past year, showing that markets can remain resilient even amid trade policy changes.
The bottom line? July reinforced the importance of keeping a long-term perspective. Market challenges can create opportunities for investors who are positioned across different asset classes. Staying focused on the bigger picture, rather than reacting to the news headlines, remains the best way to achieve financial goals.
References
1. https://www.census.gov/construction/c30/c30index.html
2. https://forum.moonshot.ai/t/kimi-k3-is-here-our-most-capable-model/480
3. https://www.fitchratings.com/research/banks/ai-market-correction-emerging-as-major-credit-risk-27-07-2026
4. https://apnews.com/article/yemen-saudi-houthis-attack-shipping-red-sea-4e25fbdad821762e478173e6308884fb
5. https://gasprices.aaa.com/
6. https://www.federalreserve.gov/newsevents/pressreleases/monetary20260729a.htm
7. https://www.whitehouse.gov/fact-sheets/2026/07/fact-sheet-president-donald-j-trump-imposes-additional-tariffs-on-canada/
Index Descriptions
S&P 500
The Standard & Poor's 500 Index is a capitalization-weighted index of 500 stocks designed to measure performance of the broad domestic economy through changes in the aggregate market value of 500 stocks representing all major industries.
Dow Jones
The Dow Jones Industrial Average consists of 30 stocks that are major factors in their industries and widely held by individuals and institutional investors.
NASDAQ
The NASDAQ Composite Index measures all NASDAQ domestic and non-U.S. based common stocks listed on The NASDAQ Stock Market. The market value, the last sale price multiplied by total shares outstanding, is calculated throughout the trading day, and is related to the total value of the Index.
MSCI Emerging Markets Index
The MSCI EM (Emerging Markets) Index is a free float-adjusted market capitalization weighted index that is designed to measure the equity market performance of the emerging market countries of the Americas, Europe, the Middle East, Africa and Asia. The MSCI EM Index consists of the following emerging market country indices: Brazil, Chile, Colombia, Mexico, Peru, Czech Republic, Egypt, Greece, Hungary, Poland, Qatar, Russia, South Africa, Turkey, United Arab Emirates, China, India, Indonesia, Korea, Malaysia, Philippines, Taiwan, and Thailand.
MSCI EAFE Index
The MSCI EAFE Index is a free float-adjusted market capitalization index that is designed to measure the equity market performance of developed markets, excluding the US & Canada. The MSCI EAFE Index consists of the following developed country indices: Australia, Austria, Belgium, Denmark, Finland, France, Germany, Hong Kong, Ireland, Israel, Italy, Japan, the Netherlands, New Zealand, Norway, Portugal, Singapore, Spain, Sweden, Switzerland and the UK.
Bloomberg US Aggregate Bond Index
The Bloomberg U.S. Aggregate Bond Index is an index of the U.S. investment-grade fixed-rate bond market, including both government and corporate bonds.
DXY
The DXY is a U.S. dollar index based on a basket of currencies, including the Euro, Yen, Pound, Canadian Dollar, Swedish Krona and Swiss Franc.