May 2026 was a positive month for investors. Stock markets climbed to record levels, even as the bond market dealt with rising inflation concerns. The S&P 500 topped 7,500 for the first time, driven largely by strong technology stocks. Long-term interest rates rose to levels not seen in nearly two decades before pulling back later in the month, helped partly by falling oil prices. Hopes for a peace deal in Iran also gave markets a boost, though the situation is still uncertain.
May also brought a new leader to the Federal Reserve (the Fed), which is the central bank of the United States. Kevin Warsh was sworn in as the new Fed Chair, marking the first leadership change at the Fed since 2018. While a new Fed Chair can raise questions about future policy, history shows that markets and the economy have done well under many different leaders. For long-term investors, the recent stock market strength is a positive sign, but maintaining a balanced portfolio remains important.
Key Market and Economic Highlights for May
• The S&P 500, Nasdaq, and Dow Jones Industrial Average gained 5.1%, 8.4%, and 2.8%, respectively, for the month. All three major U.S. indices finished the month at new all-time highs.
• Volatility declined over the month, as measured by the CBOE VIX index, ending May at 15.32.
• International developed markets returned 2.6% based on the MSCI EAFE Index in U.S. dollar terms, while emerging markets returned 9.5% based on the MSCI EM Index.
• The 30-year Treasury yield reached 5.18%, its highest level in nearly two decades, before finishing the month below 5%. The 10-year Treasury yield rose to 4.4%. The Bloomberg U.S. Aggregate Bond Index returned 0.3% for the month.
• Oil prices fell with Brent crude closing at approximately $92 per barrel and WTI at $88.
• Gold ended the month slightly lower at $4,539 per ounce. The U.S. Dollar Index stood at 98.94, also down only slightly.
• First quarter real GDP was revised lower from 2.0% quarter-over-quarter to 1.6%. April inflation showed headline CPI at 3.8% year-over-year and core CPI at 2.8%.
Long-term interest rates spiked before pulling back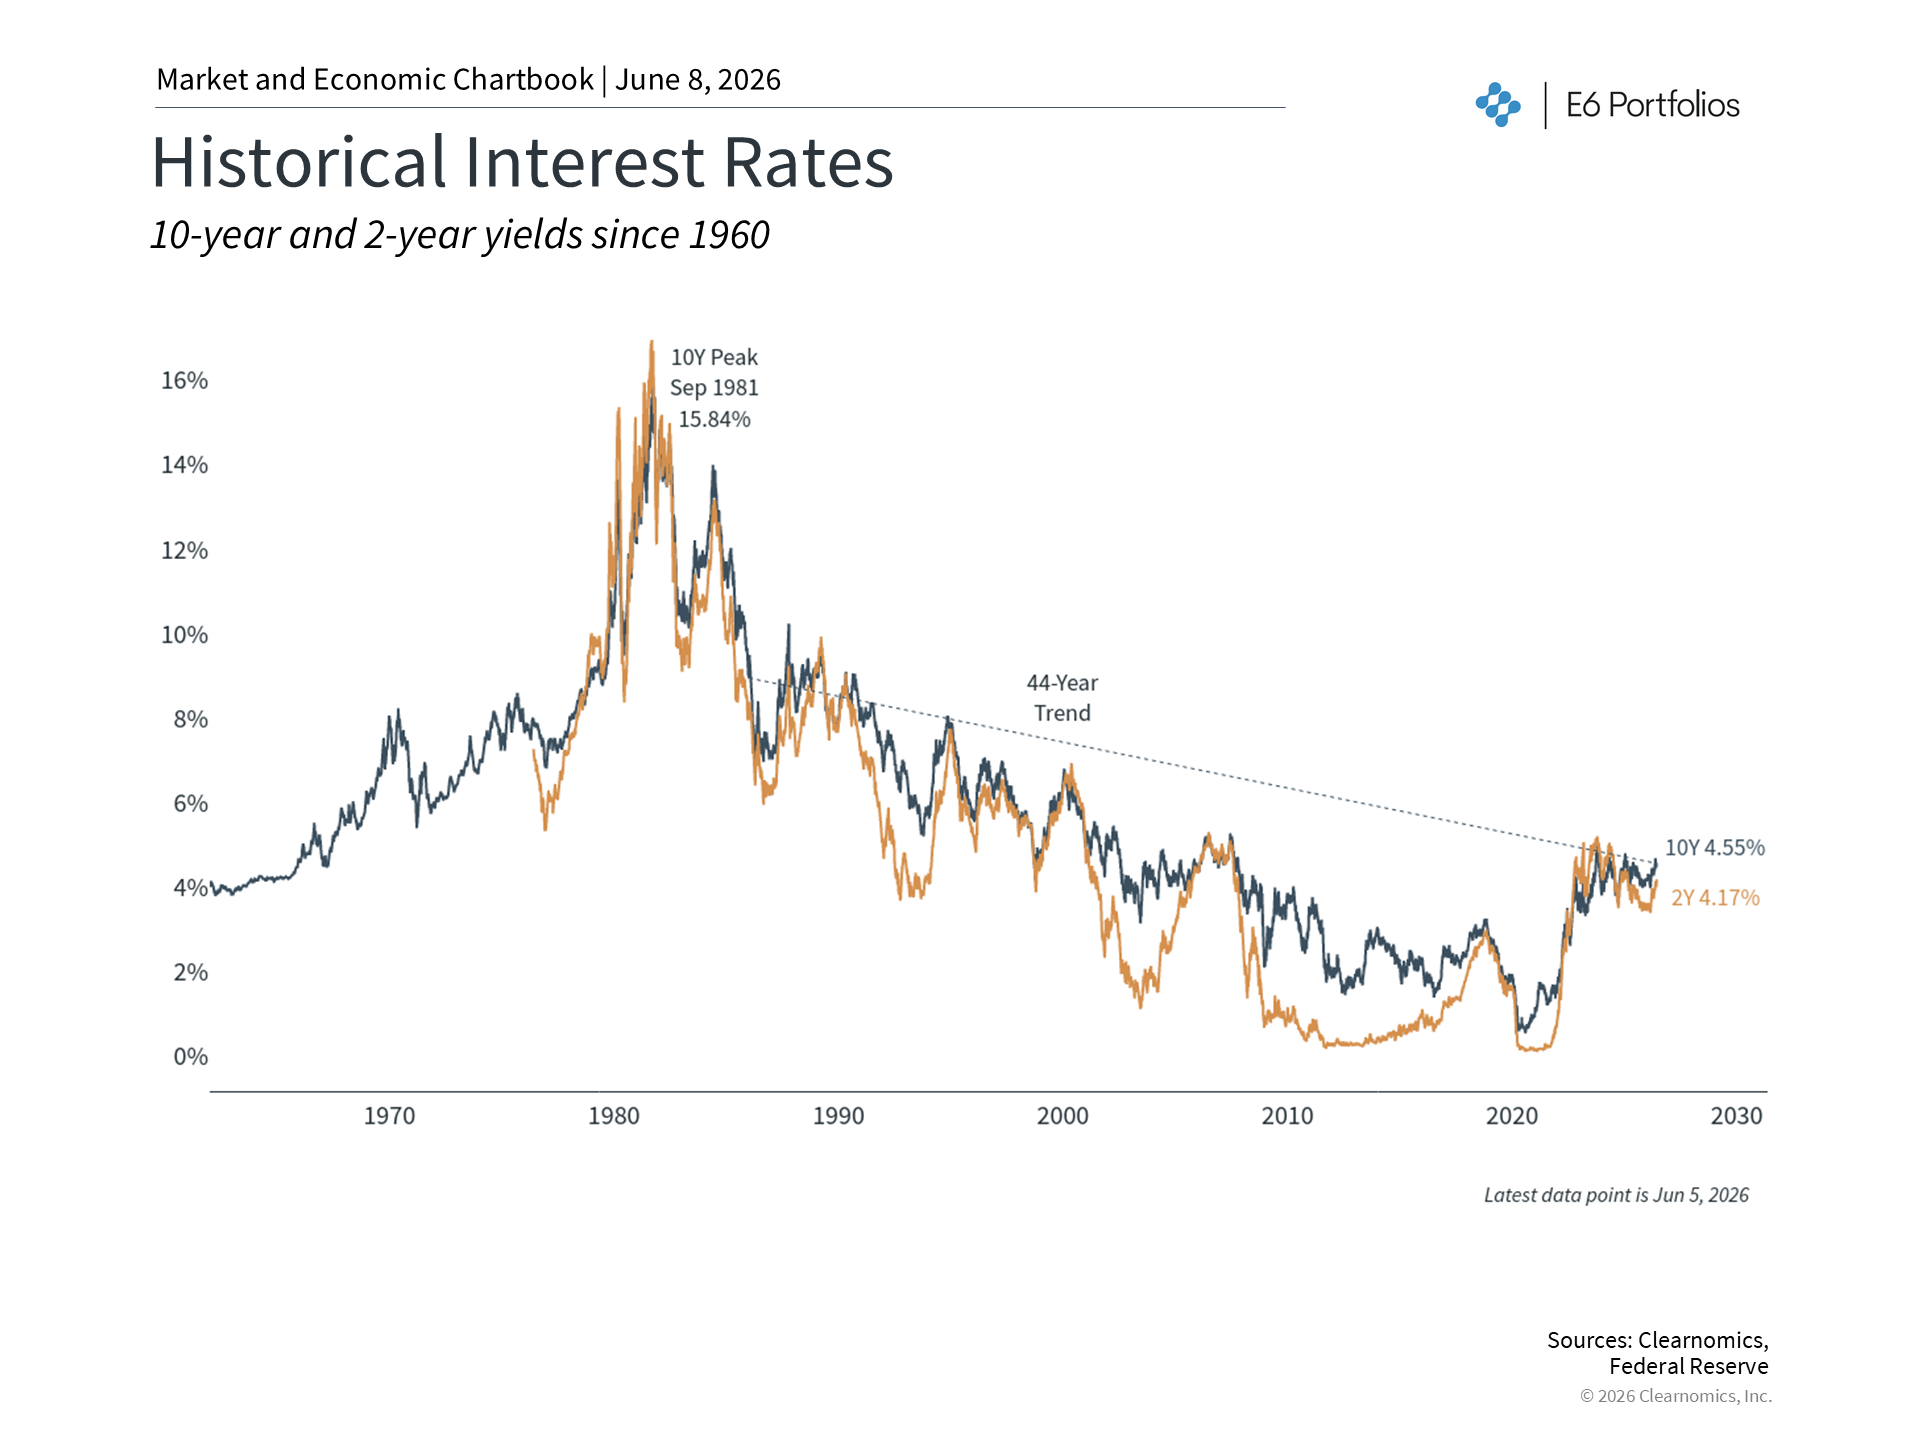 |
One of the biggest stories in May was the movement in interest rates. The 30-year U.S. Treasury yield, which is the interest rate on long-term government bonds, hit its highest point in nearly two decades before settling back below 5%.1 This happened because inflation reports came in higher than expected, largely due to rising energy prices. When inflation goes up, interest rates tend to rise as well, since investors want more return to make up for the fact that money buys less over time.
Higher interest rates affect everyday life. For consumers, they mean higher costs on things like mortgages and personal loans. For businesses, borrowing to grow becomes more expensive. For financial markets, higher rates can reduce the value of future earnings, which puts pressure on asset prices. That said, higher bond yields also mean bonds now offer more income than they have in years, which can be a benefit for diversified portfolios.
It is worth keeping perspective here. Interest rates have been hard to predict in recent years, and the situation in Iran continues to change. While rates remain elevated, they are still well below the levels many feared when inflation was at its peak.
Stock markets climbed to record levels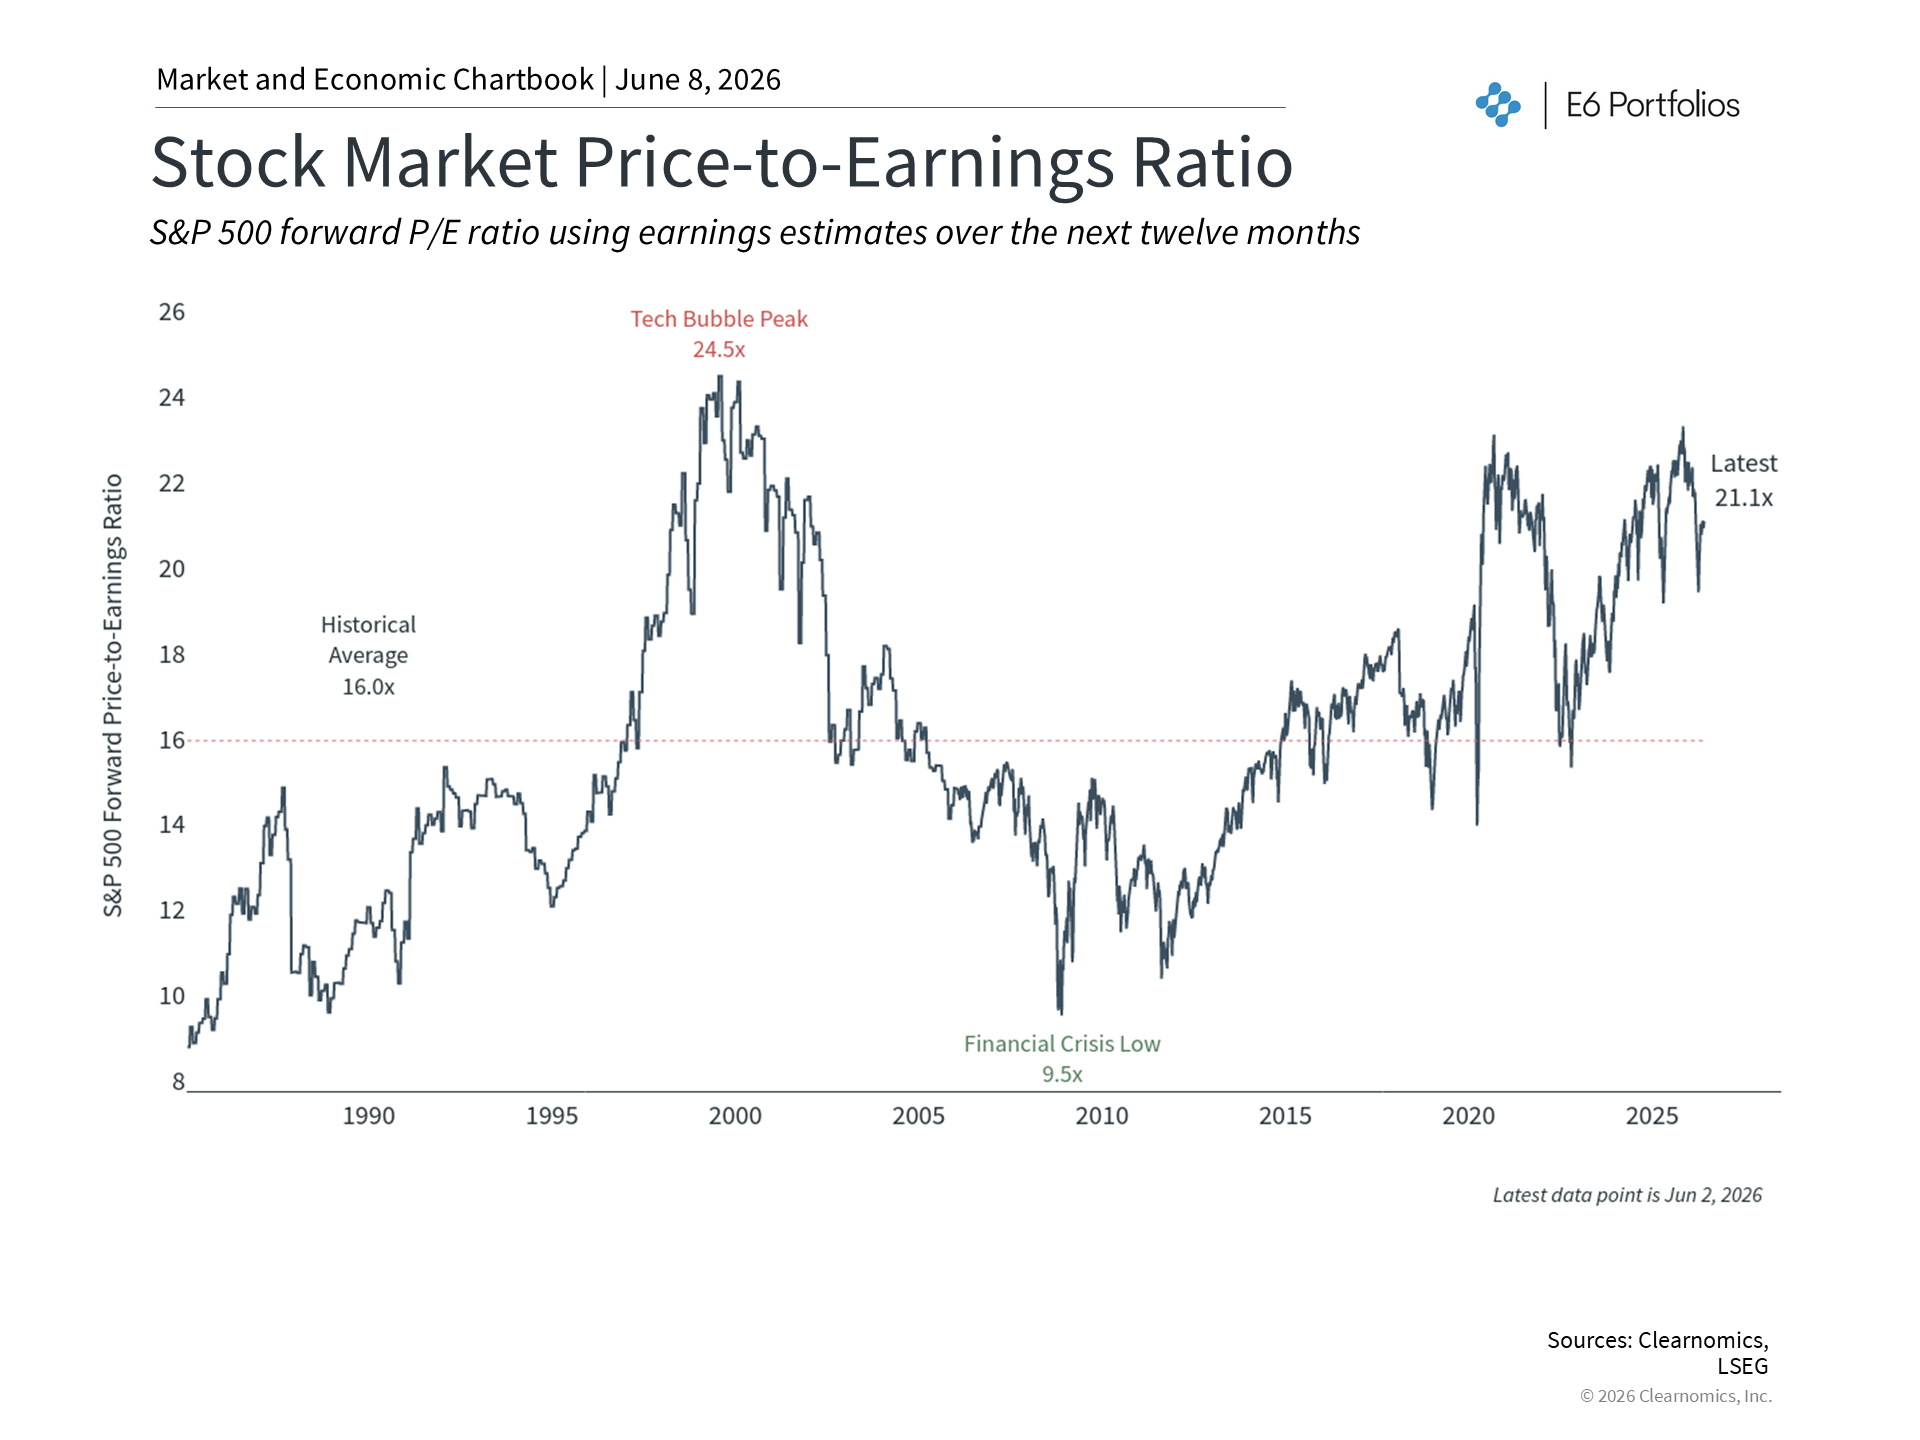 |
Despite pressure on the bond market, stocks continued to rise. The S&P 500 crossed 7,500 for the first time in May, and markets have now set 22 all-time highs so far this year.3 The Magnificent 7 and other large technology companies continued to lead, but gains were spread more broadly across the market than in some prior years. Strong corporate earnings, meaning the profits that companies report, have helped support these gains, and analysts expect continued earnings growth in the coming year.4
This environment has also sparked interest in upcoming initial public offerings (IPOs). An IPO is when a private company sells shares to the public for the first time. Companies such as SpaceX, Anthropic, OpenAI, and others have been mentioned as possible candidates. The long-term importance of IPOs is that they expand the range of investment choices available to all investors, not just the immediate price moves after listing.
It is worth noting that stock market valuations, which measure how expensive stocks are relative to company earnings, remain above long-term historical averages. The S&P 500 price-to-earnings ratio is around 20.9x. Elevated valuations do not predict short-term market moves, but they are a reason to keep portfolios balanced across different sectors, company sizes, and investment styles.
A new Fed Chair takes the helm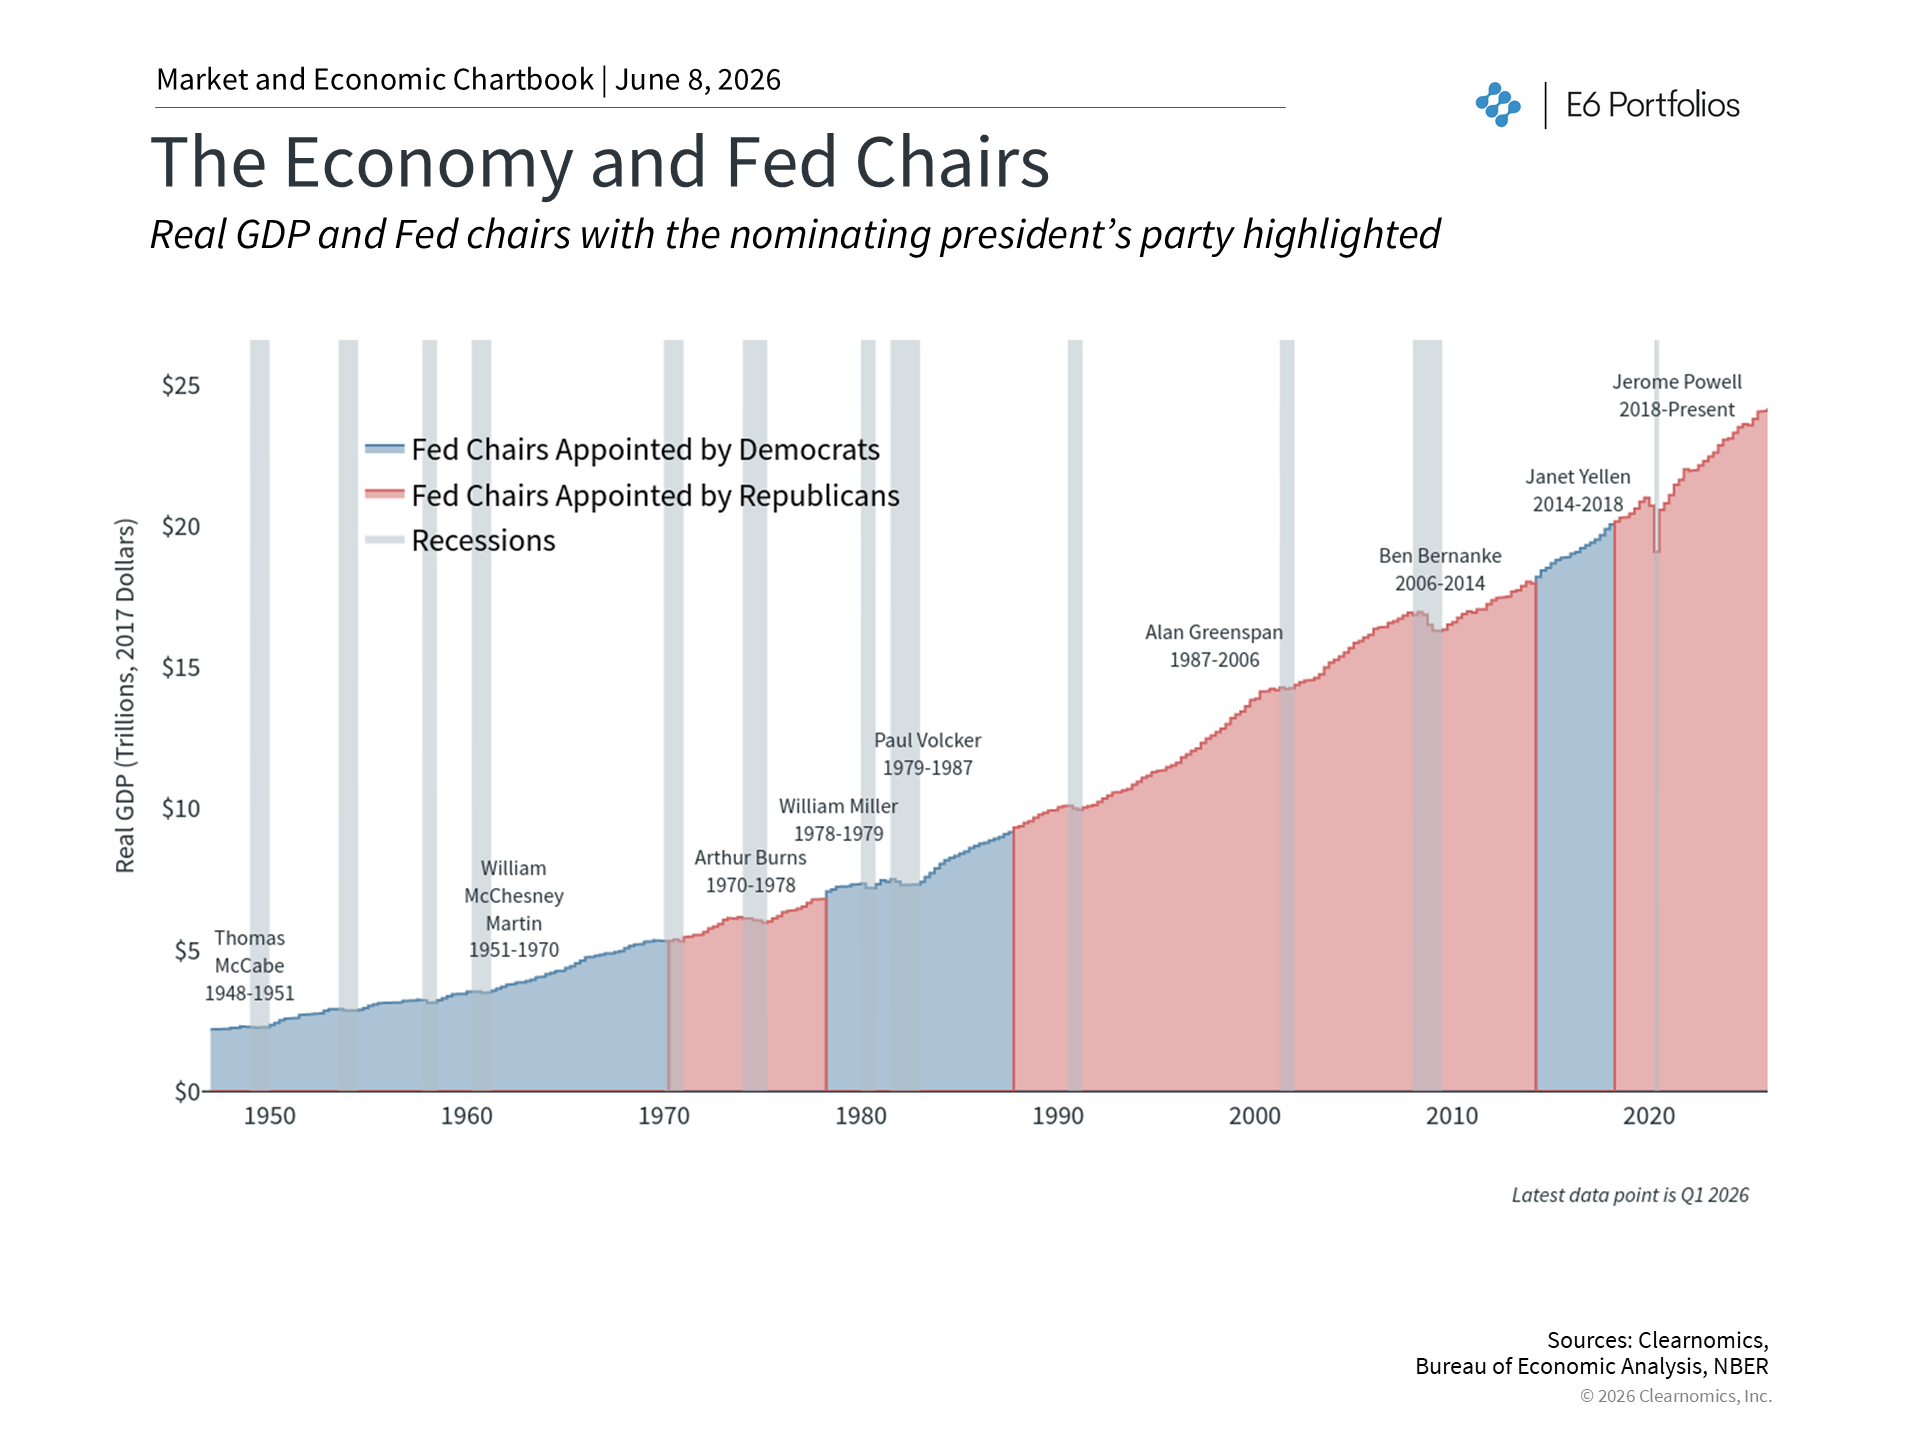 |
Kevin Warsh was sworn in as the new Chair of the Federal Reserve in May, taking over from Jerome Powell. Warsh previously served on the Fed's Board of Governors during the 2008 global financial crisis, so he is a familiar figure to financial markets. Fed leadership changes are rare by design, so they naturally draw attention and can create some uncertainty about the future direction of policy.
The Fed currently faces a tricky situation. The overall economy is still healthy, but inflation has picked up recently while the job market has sent mixed signals. Normally, a weaker job market would call for lower interest rates to encourage hiring, while higher inflation would call for raising rates to cool things down. These competing pressures make policy decisions difficult, and markets have shifted from expecting rate cuts to now pricing in at least one rate hike.
For long-term investors, history is reassuring. The economy has grown through the tenures of many different Fed chairs and across a wide range of policy environments. The most important drivers of long-run investment returns are corporate earnings, innovation, and productivity, not who leads the Fed.
The bottom line? May brought new records for the stock market, continuing a strong stretch for investors. While inflation, the new Fed Chair, and global events will likely keep generating headlines, the best path for investors remains staying focused on long-term financial goals.
References
1. https://home.treasury.gov/policy-issues/financing-the-government/interest-rate-statistics
2. https://gasprices.aaa.com/
3. Clearnomics research based on Standard & Poor's index data
4. Clearnomics research based on LSEG earnings data
5. https://www.cmegroup.com/markets/interest-rates/cme-fedwatch-tool.html
Index Descriptions
S&P 500
The Standard & Poor's 500 Index is a capitalization-weighted index of 500 stocks designed to measure performance of the broad domestic economy through changes in the aggregate market value of 500 stocks representing all major industries.
Dow Jones
The Dow Jones Industrial Average is comprised of 30 stocks that are major factors in their industries and widely held by individuals and institutional investors.
NASDAQ
The NASDAQ Composite Index measures all NASDAQ domestic and non-U.S. based common stocks listed on The NASDAQ Stock Market. The market value, the last sale price multiplied by total shares outstanding, is calculated throughout the trading day, and is related to the total value of the Index.
MSCI Emerging Markets Index
The MSCI EM (Emerging Markets) Index is a free float-adjusted market capitalization weighted index that is designed to measure the equity market performance of the emerging market countries of the Americas, Europe, the Middle East, Africa and Asia. The MSCI EM Index consists of the following emerging market country indices: Brazil, Chile, Colombia, Mexico, Peru, Czech Republic, Egypt, Greece, Hungary, Poland, Qatar, Russia, South Africa, Turkey, United Arab Emirates, China, India, Indonesia, Korea, Malaysia, Philippines, Taiwan, and Thailand.
MSCI EAFE Index
The MSCI EAFE Index is a free float-adjusted market capitalization index that is designed to measure the equity market performance of developed markets, excluding the US & Canada. The MSCI EAFE Index consists of the following developed country indices: Australia, Austria, Belgium, Denmark, Finland, France, Germany, Hong Kong, Ireland, Israel, Italy, Japan, the Netherlands, New Zealand, Norway, Portugal, Singapore, Spain, Sweden, Switzerland and the UK.
Bloomberg US Aggregate Bond Index
The Bloomberg U.S. Aggregate Bond Index is an index of the U.S. investment-grade fixed-rate bond market, including both government and corporate bonds.