Stock markets have delivered strong returns over the past quarter, but a recent bout of volatility may have left some investors wondering what happened. The Nasdaq dropped 4.2% on Friday, June 5, marking its biggest single-day decline in a year.
Interestingly, the drop came after a strong jobs report, which is generally good news for the economy, but it also raised the possibility that the Federal Reserve (the central bank of the United States, often called "the Fed") could raise interest rates before the end of the year.1 Geopolitical tensions also added to investor concerns. While market swings are normal, these recent moves have identifiable causes that history can help explain.
Even after the pullback, major market indices are still up noticeably this year. History also shows that markets have performed well through many different Fed rate hike cycles, so investors do not need to overreact.
The market has experienced renewed volatility
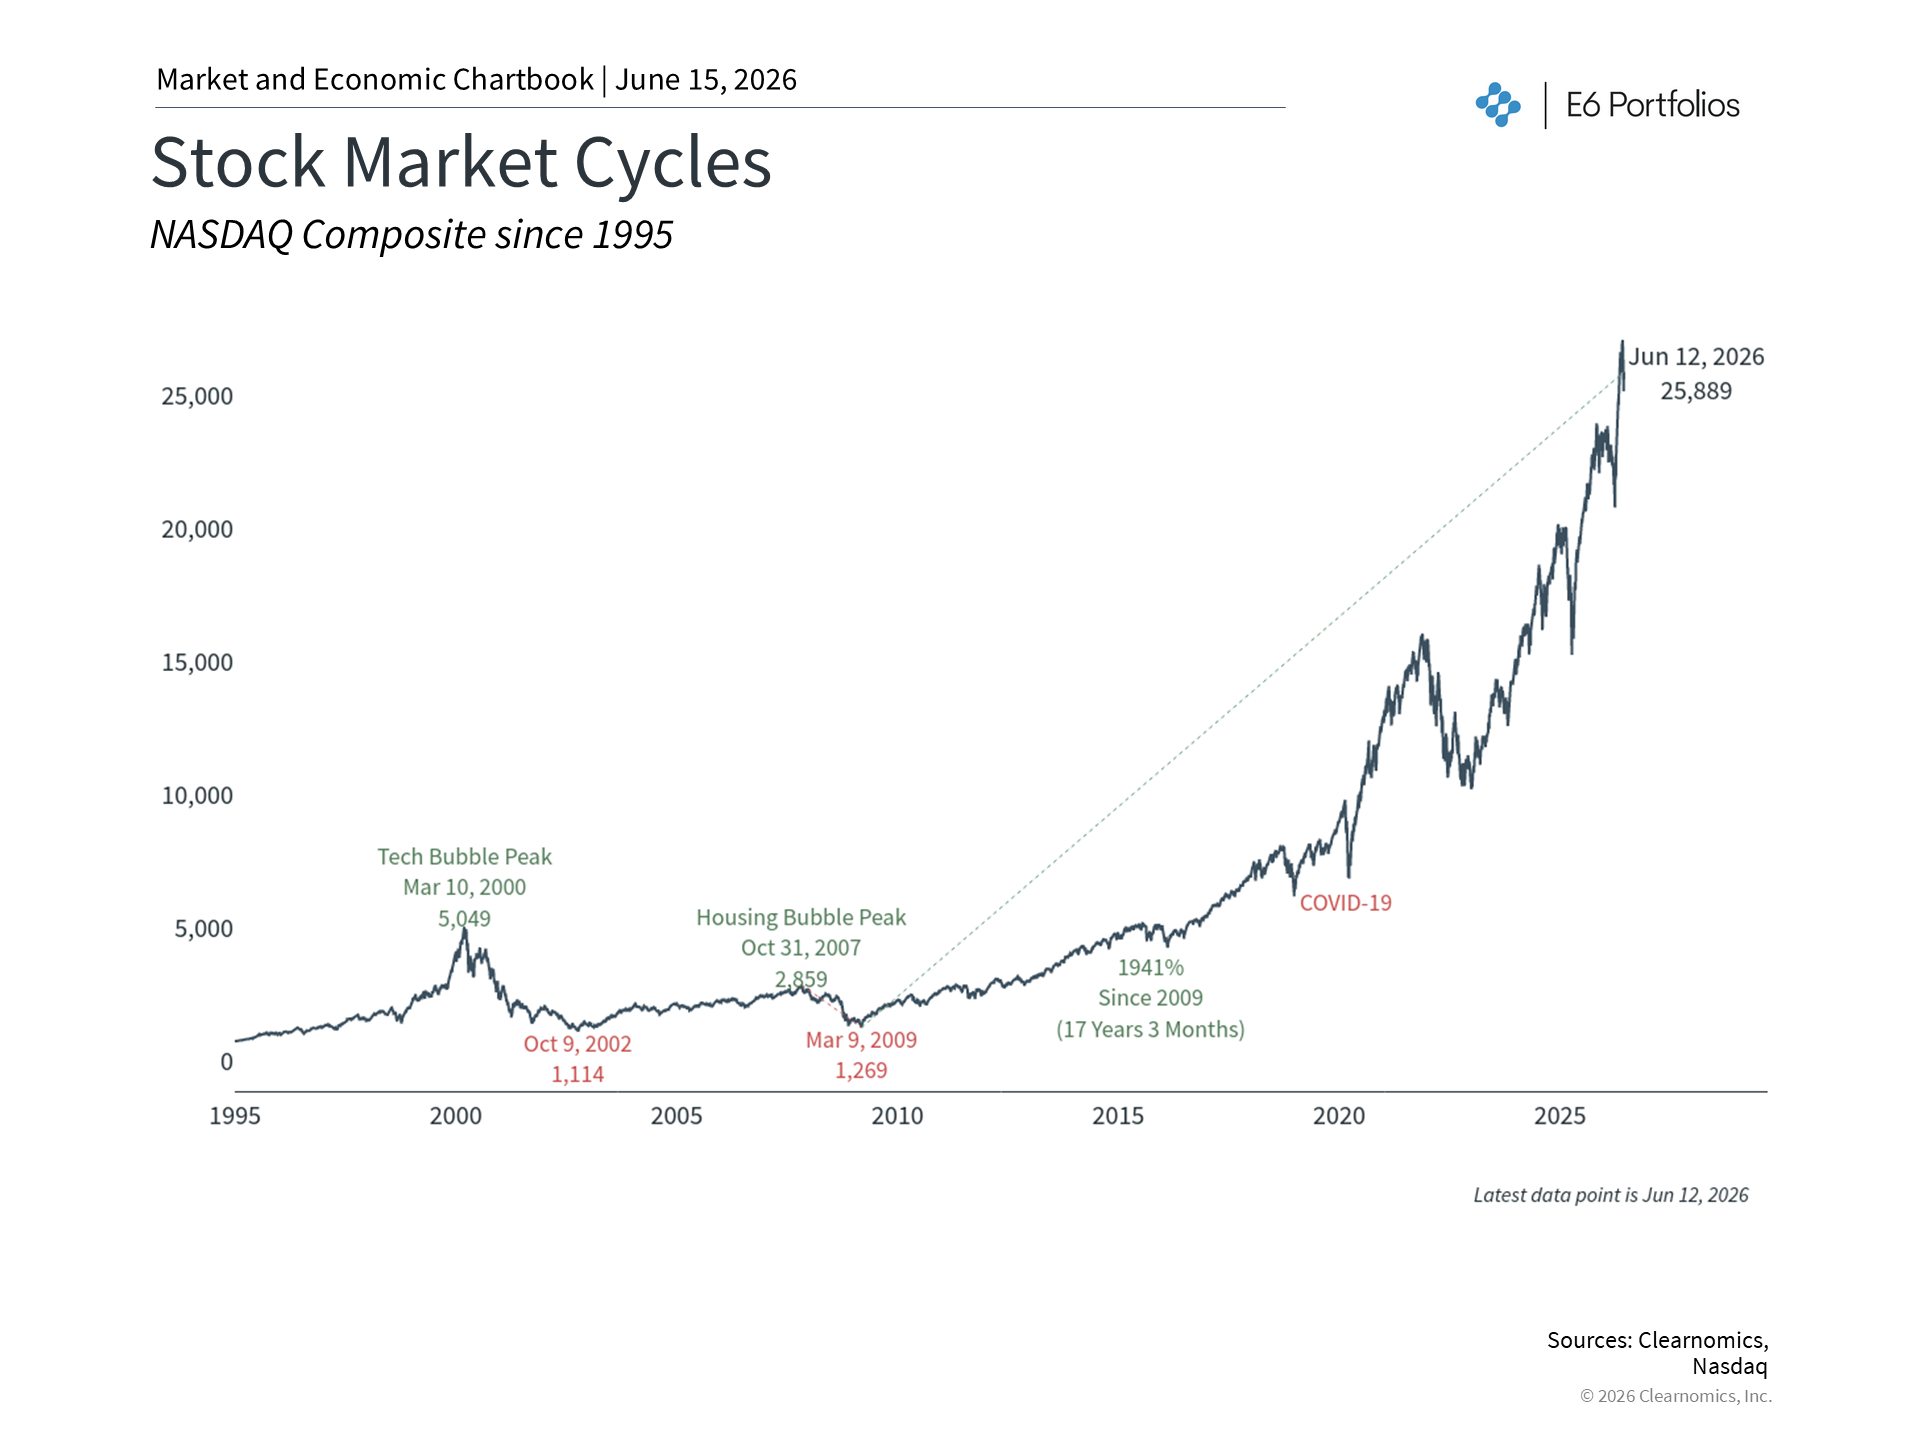 |
Major indices, including the S&P 500, Dow Jones Industrial Average, and the Nasdaq, have gained ground in recent months. Some of this strength reflects a "relief rally," meaning markets rose because fears about the economic impact of the Middle East conflict turned out to be less severe than expected. Strong corporate earnings and excitement about upcoming initial public offerings (when companies first sell shares to the public) also helped.
Meanwhile, the bond market (where investors lend money to governments and companies in exchange for regular interest payments) has faced a tougher environment. Interest rates have risen across the board, with the 10-year Treasury yield sitting around 4.5%.2 Bond investors have been signaling that rates may stay higher for longer, and the stock market has now begun to respond to this same reality.
Technology stocks can be sensitive to interest rates
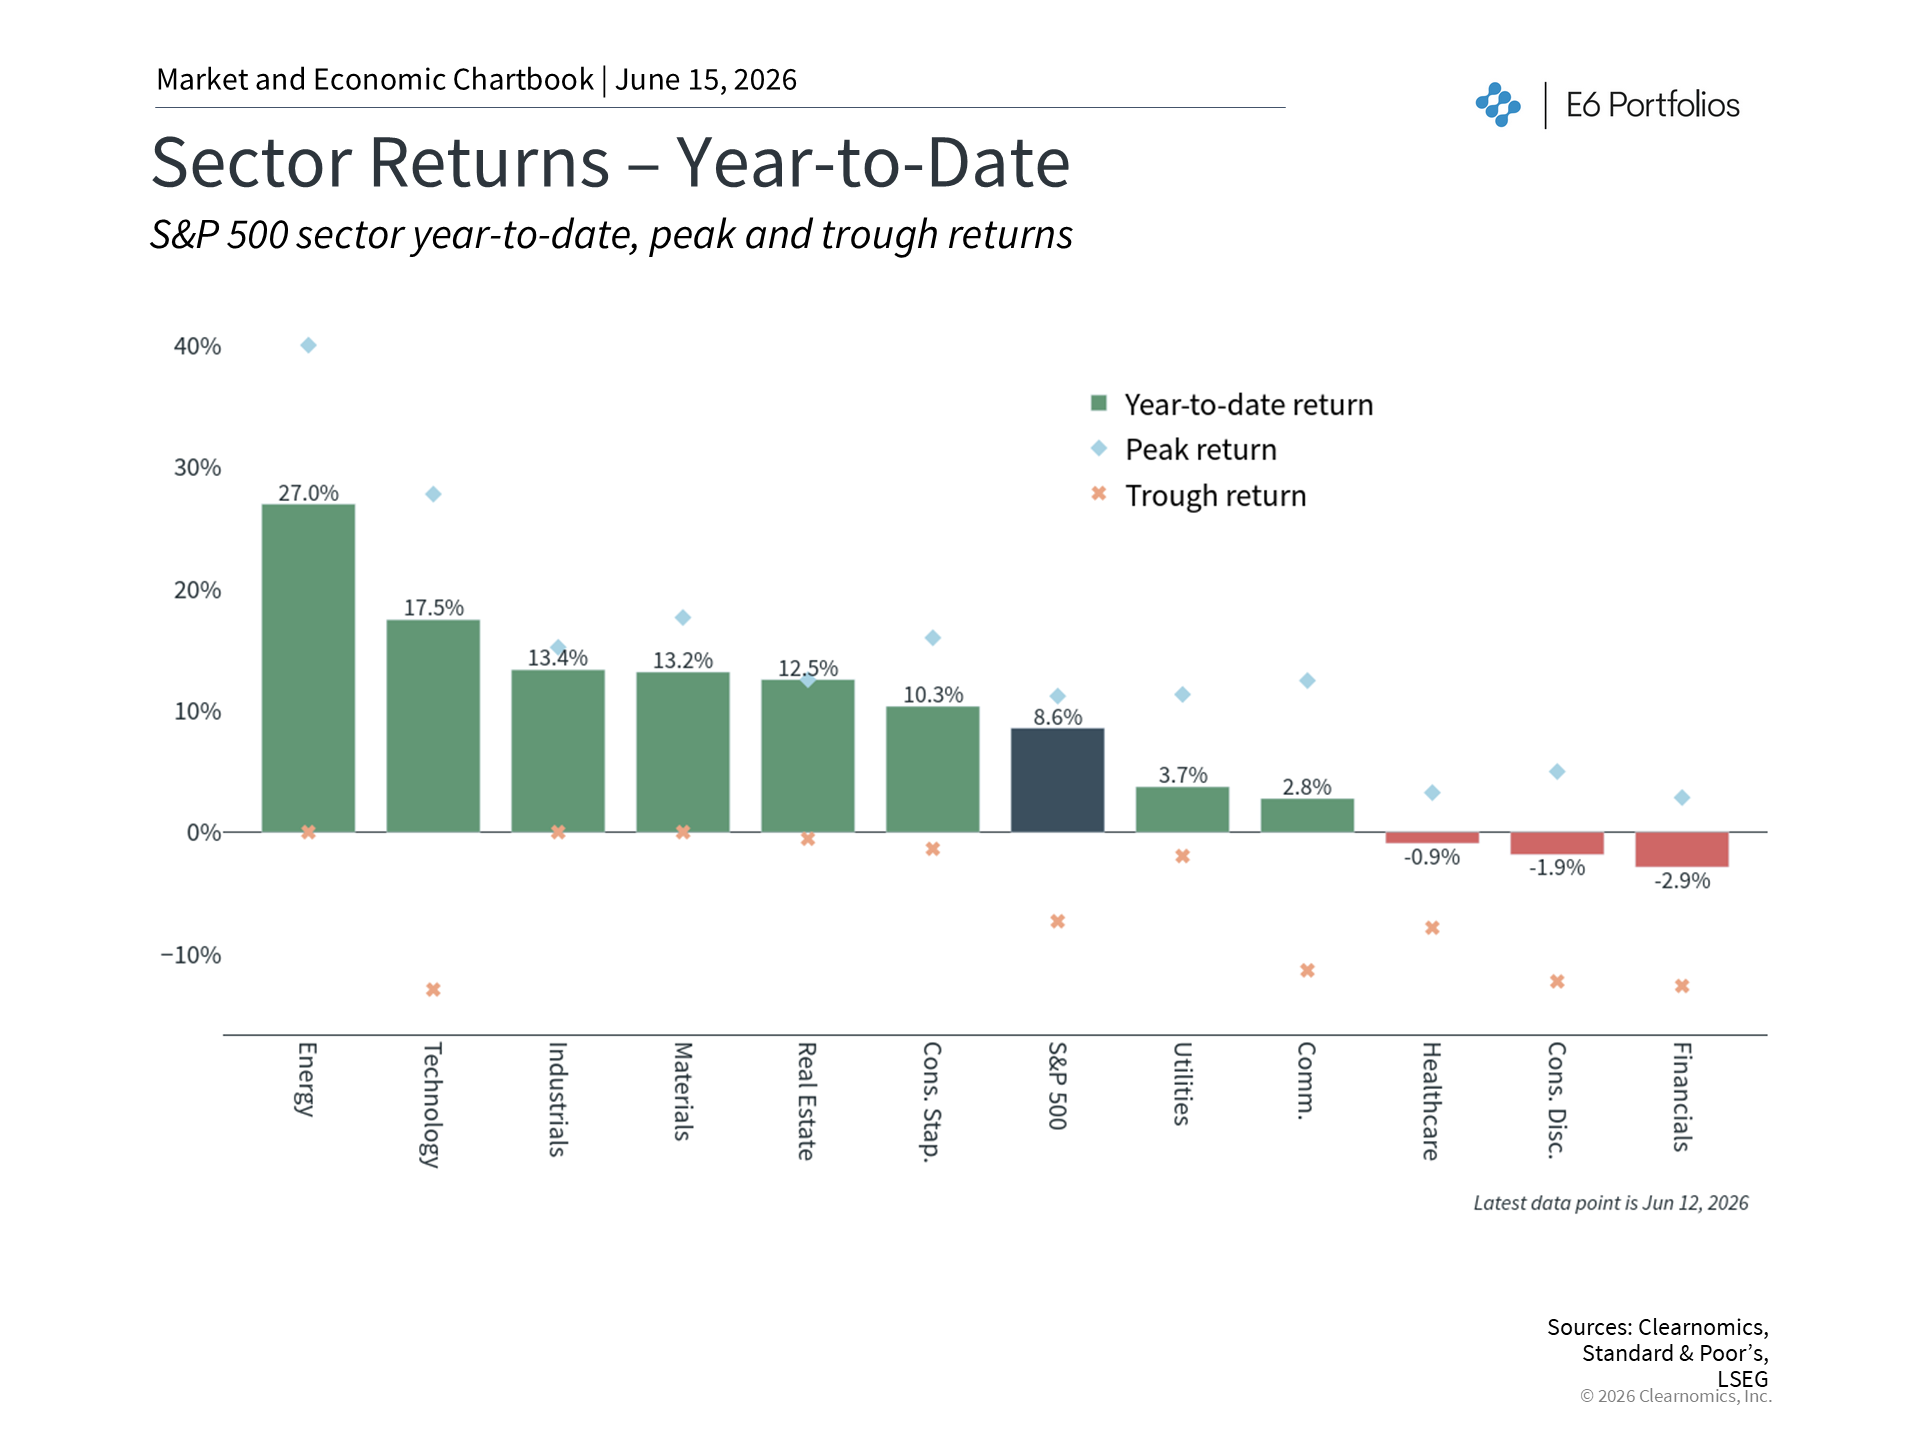 |
Technology stocks tend to be especially sensitive to interest rate changes. Investors buy these stocks because they expect strong growth far into the future. Since interest rates affect how much those future profits are worth today, even small rate changes can cause large price swings. The Magnificent 7, a group of large technology companies, lost about half of its value from late 2021 to late 2022 when rates rose sharply, before eventually recovering to new highs.3
This matters because technology-related stocks now make up a much larger share of the overall market. The Magnificent 7 alone accounts for roughly one-third of the S&P 500.4 This means many investors may hold more exposure to these companies than they realize, making portfolio balance and monitoring asset allocations (how investments are spread across different types of assets) more important than ever.
Markets have performed well across Fed rate hike cycles
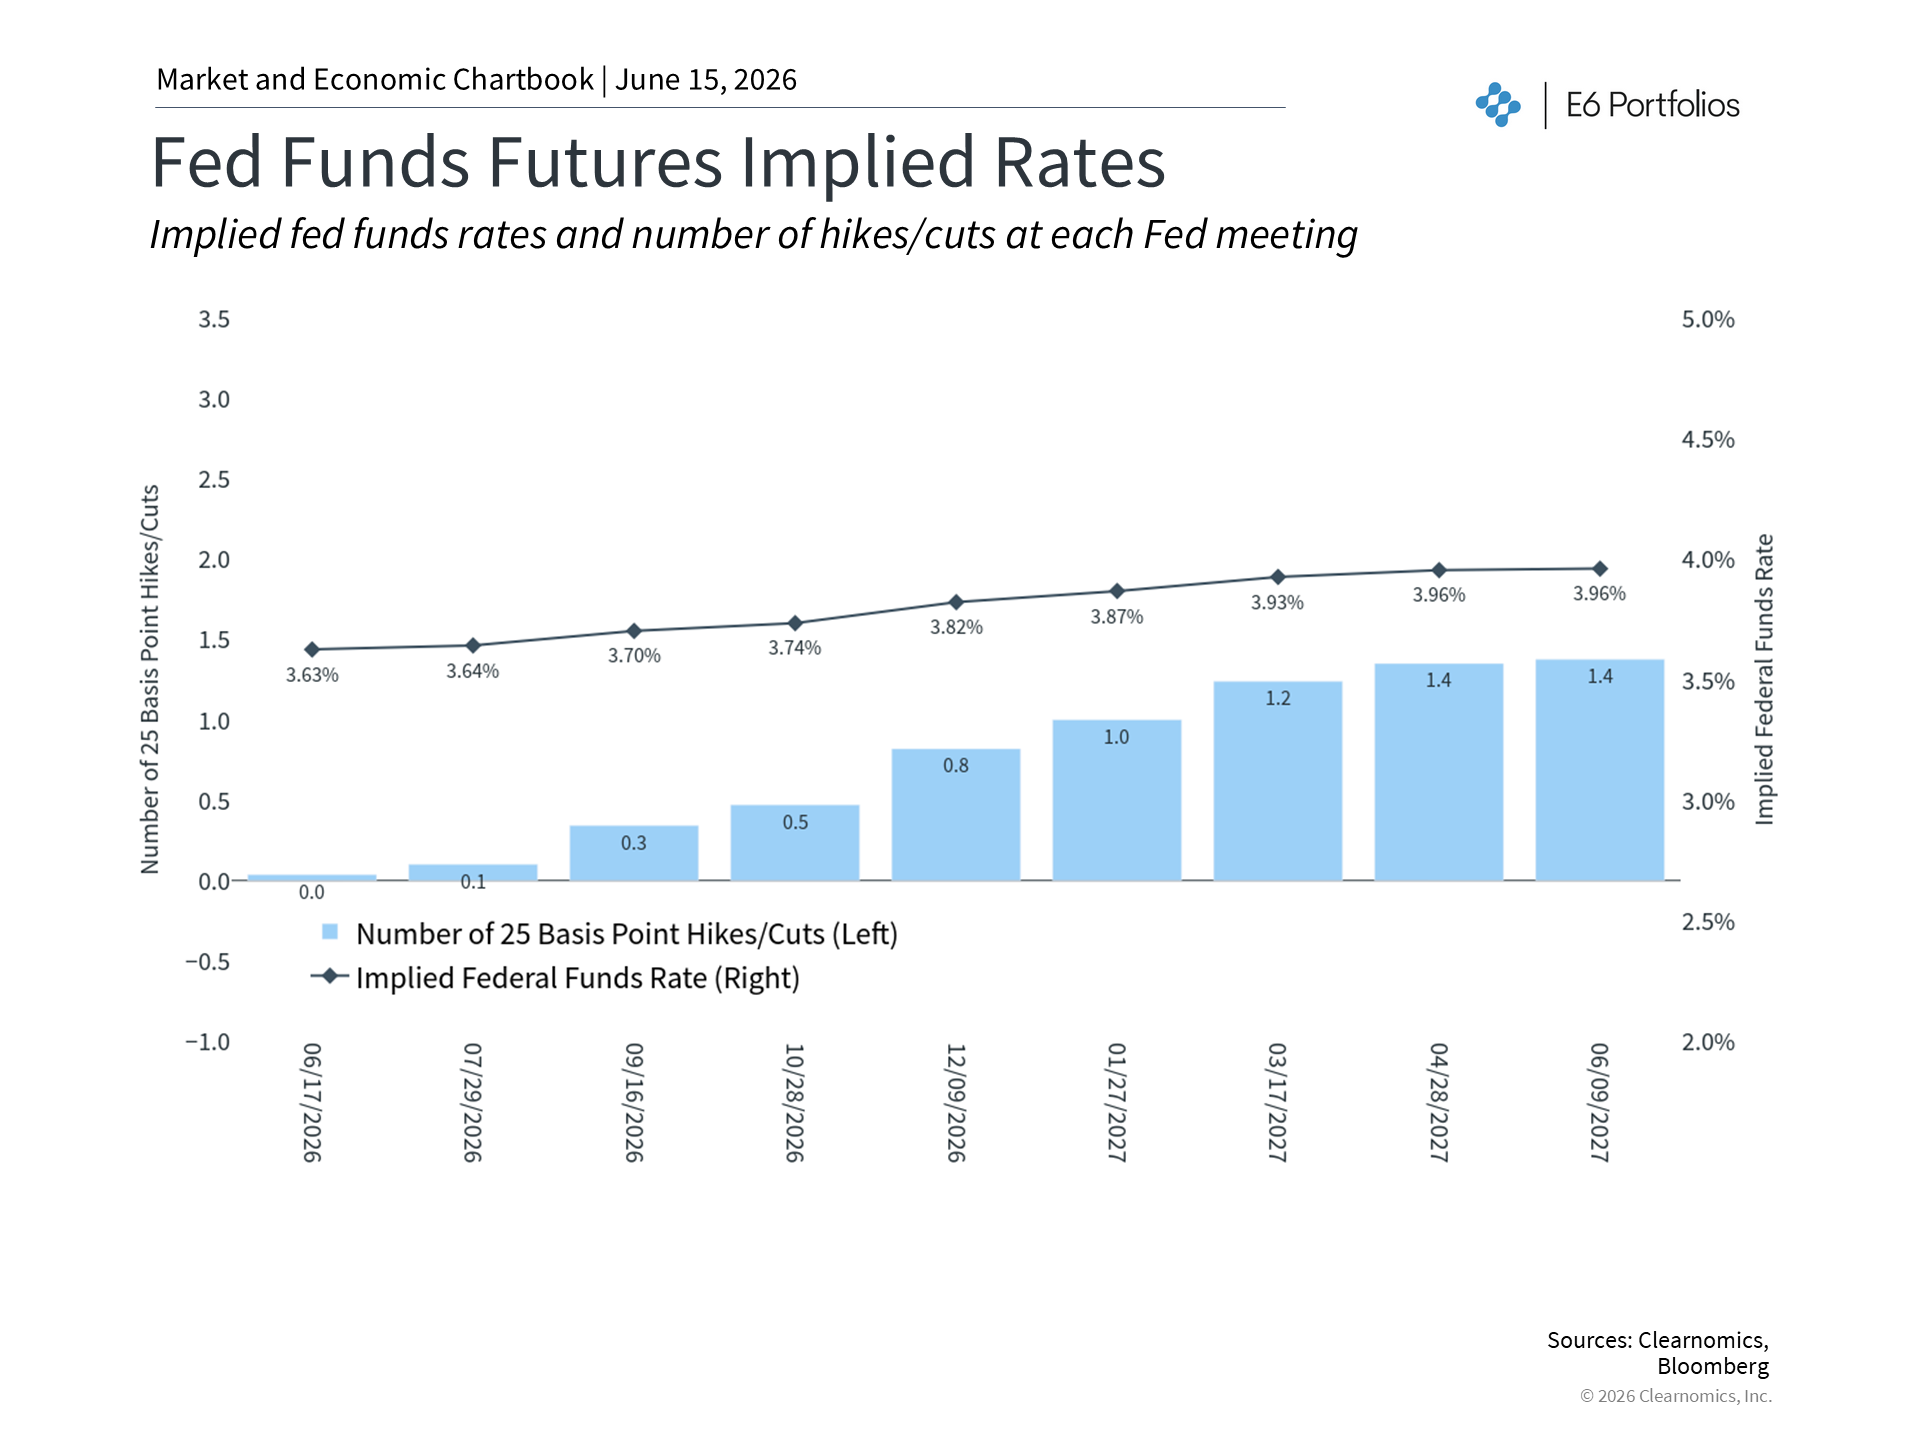 |
Expectations for Fed policy can shift quickly. Earlier this year, many expected the Fed to keep cutting rates. Those expectations changed as energy prices rose and the job market strengthened. There is also uncertainty around how the new Fed chair, Kevin Warsh, will approach inflation. He has historically been seen as someone who favors higher rates to keep prices stable, which could put him at odds with calls for rate cuts from the White House.
That said, even if markets are right about what comes next, the Fed is not expected to raise rates until the end of the year, and only by 25 basis points (a small unit used to measure interest rate changes, where 100 basis points equals 1%). This is modest compared to the 2022 to 2023 cycle, when the Fed raised rates from near zero all the way to 5.25% across 11 separate increases. Importantly, the stock market has historically performed well during periods of rising rates, particularly when those increases reflect a healthy economy supporting corporate earnings.
The bottom line? Recent volatility reflects the possibility of Fed rate hikes and renewed geopolitical tensions, but neither is a reason to fundamentally change long-term plans. While parts of the stock market may experience short-term volatility, history shows that markets can perform well across many different rate cycles.
References
1. https://www.cmegroup.com/markets/interest-rates/cme-fedwatch-tool.html
2. https://home.treasury.gov/policy-issues/financing-the-government/interest-rate-statistics
3. The Magnificent 7 includes Apple, Microsoft, Nvidia, Amazon, Alphabet, Meta, and Tesla. The peak from 2021 to 2022 occurred on November 19, 2021, and the trough occurred on December 27, 2022.
4. Clearnomics research based on Standard & Poor's data
5. https://www.wsj.com/opinion/the-high-cost-of-the-feds-mission-creep-role-responsibility-monetary-policy-economy-20a352f8
6. https://www.federalreserve.gov/monetarypolicy/fomccalendars.htm#32979
Index Descriptions
S&P 500
The Standard & Poor's 500 Index is a capitalization-weighted index of 500 stocks designed to measure performance of the broad domestic economy through changes in the aggregate market value of 500 stocks representing all major industries.
Dow Jones
The Dow Jones Industrial Average is comprised of 30 stocks that are major factors in their industries and widely held by individuals and institutional investors.
NASDAQ
The NASDAQ Composite Index measures all NASDAQ domestic and non-U.S. based common stocks listed on The NASDAQ Stock Market. The market value, the last sale price multiplied by total shares outstanding, is calculated throughout the trading day, and is related to the total value of the Index.